
In the last half century, so much has changed about the way people move around their communities. Yet, our public transit systems have largely remained static, and transit agencies are struggling. Swift commercial and residential development, evolving land use, and rapid population growth are contributing to this transformation, especially over the past two decades. Transit agencies are losing ridership, with slow rates of post-pandemic recovery.
Adding another layer of complexity is the influence of new types of services offered by private companies. These entities have introduced ride-hailing, bike shares, and e-scooters to the marketplace, often with little to no advanced planning or collaboration with local agencies. As convenient as some of these changes have been, not everyone has benefitted equally. With predictions of an impending fiscal cliff, the future of our transportation systems is uncertain. As public transit is a key contributor to the economic vitality, thoughtful reimagining of these services will be crucial for the socioeconomic health of a region.
In light of all this, it is not surprising that many agencies are initiating network redesign projects to align their services with updated, real-world movement patterns and to better serve equity populations. Many transit networks were originally designed to cater to 9-5 commute trips, but equity populations depend on transit for almost all their travel needs. Accessibility to key destinations, not just commute locations, is foundational to ensuring equity in our transit systems.
In the past, agencies relied mainly on sporadic rider surveys to inform how they adjusted their resources, finding a balance between service availability and regularity. However, such surveys don’t offer a full view of a community's transportation preferences and needs.
Today, thanks to big data, agencies can draw from a more comprehensive dataset for their decision-making. This includes data from Automatic Passenger Counters (APCs) (which shows stop-by-stop ridership), fare card entry and exit records, operational insights from Automatic Vehicle Location (AVL) systems, and Location-Based Services data (LBS) (which provides anonymized tracking of daily travel patterns for millions). By tapping into these diverse data sources, agencies can better serve the communities in which they operate.
At Cambridge Systematics, we leverage our data analytics platform, LOCUS, to inform our approach to network redesign projects. When we partner with transit agencies, our goal is to enhance network service using ground-truthed intelligence, with equity and accessibility at the forefront. In this piece, we will share three key questions to ask as you’re starting a network redesign, as well as how big data (and LOCUS) can help answer them.
How competitive is transit in the region?
Simply put, transit competitiveness is a measure of how attractive and convenient public transit is compared to alternatives, such as driving. When transit competitiveness is high, it is more likely to appeal to more travelers and capture a bigger share of the total travel in that market.
Factors contributing to the competitiveness of public transit include (but are not limited to) speed, frequency, reliability, accessibility, and affordability. These factors impact the total time riders spend on a trip. If driving time is significantly faster than transit time, transit is going to be a less attractive option for travelers.
Travel time ratio – the ratio of the transit travel time to driving time – is a key indicator of competitiveness. The higher the ratio, the less competitive transit is compared to auto.
Where are the areas for improvement in the system?
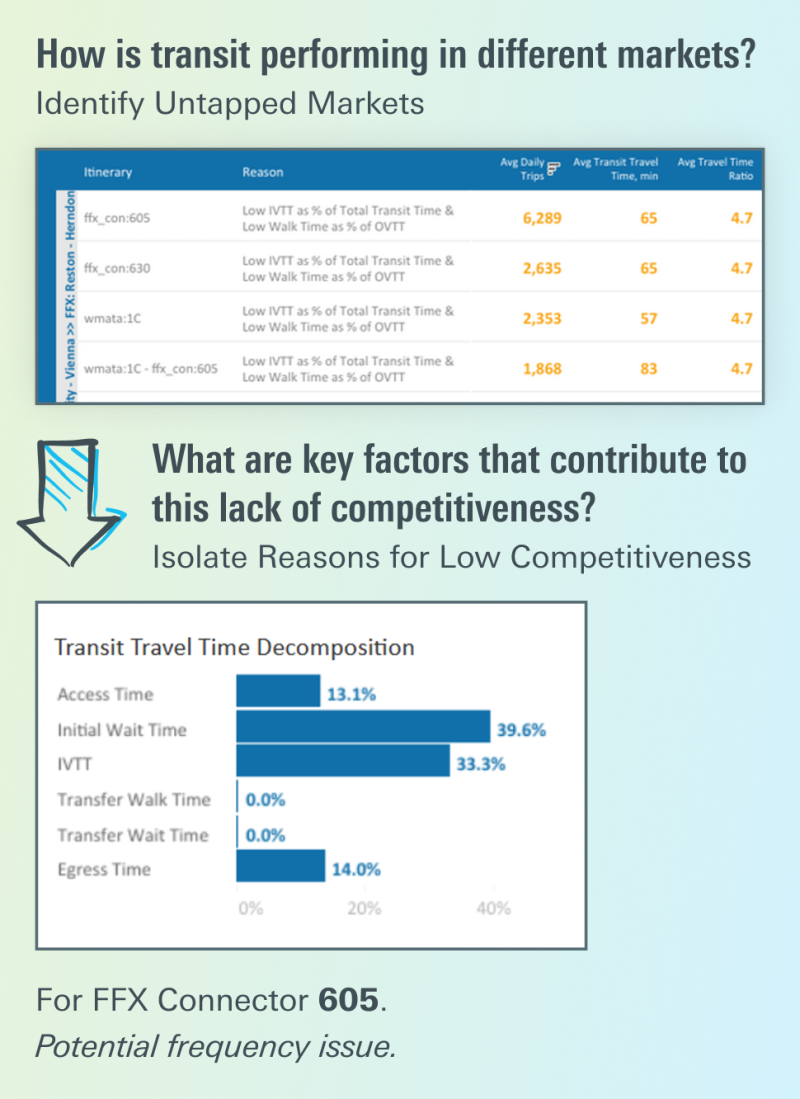
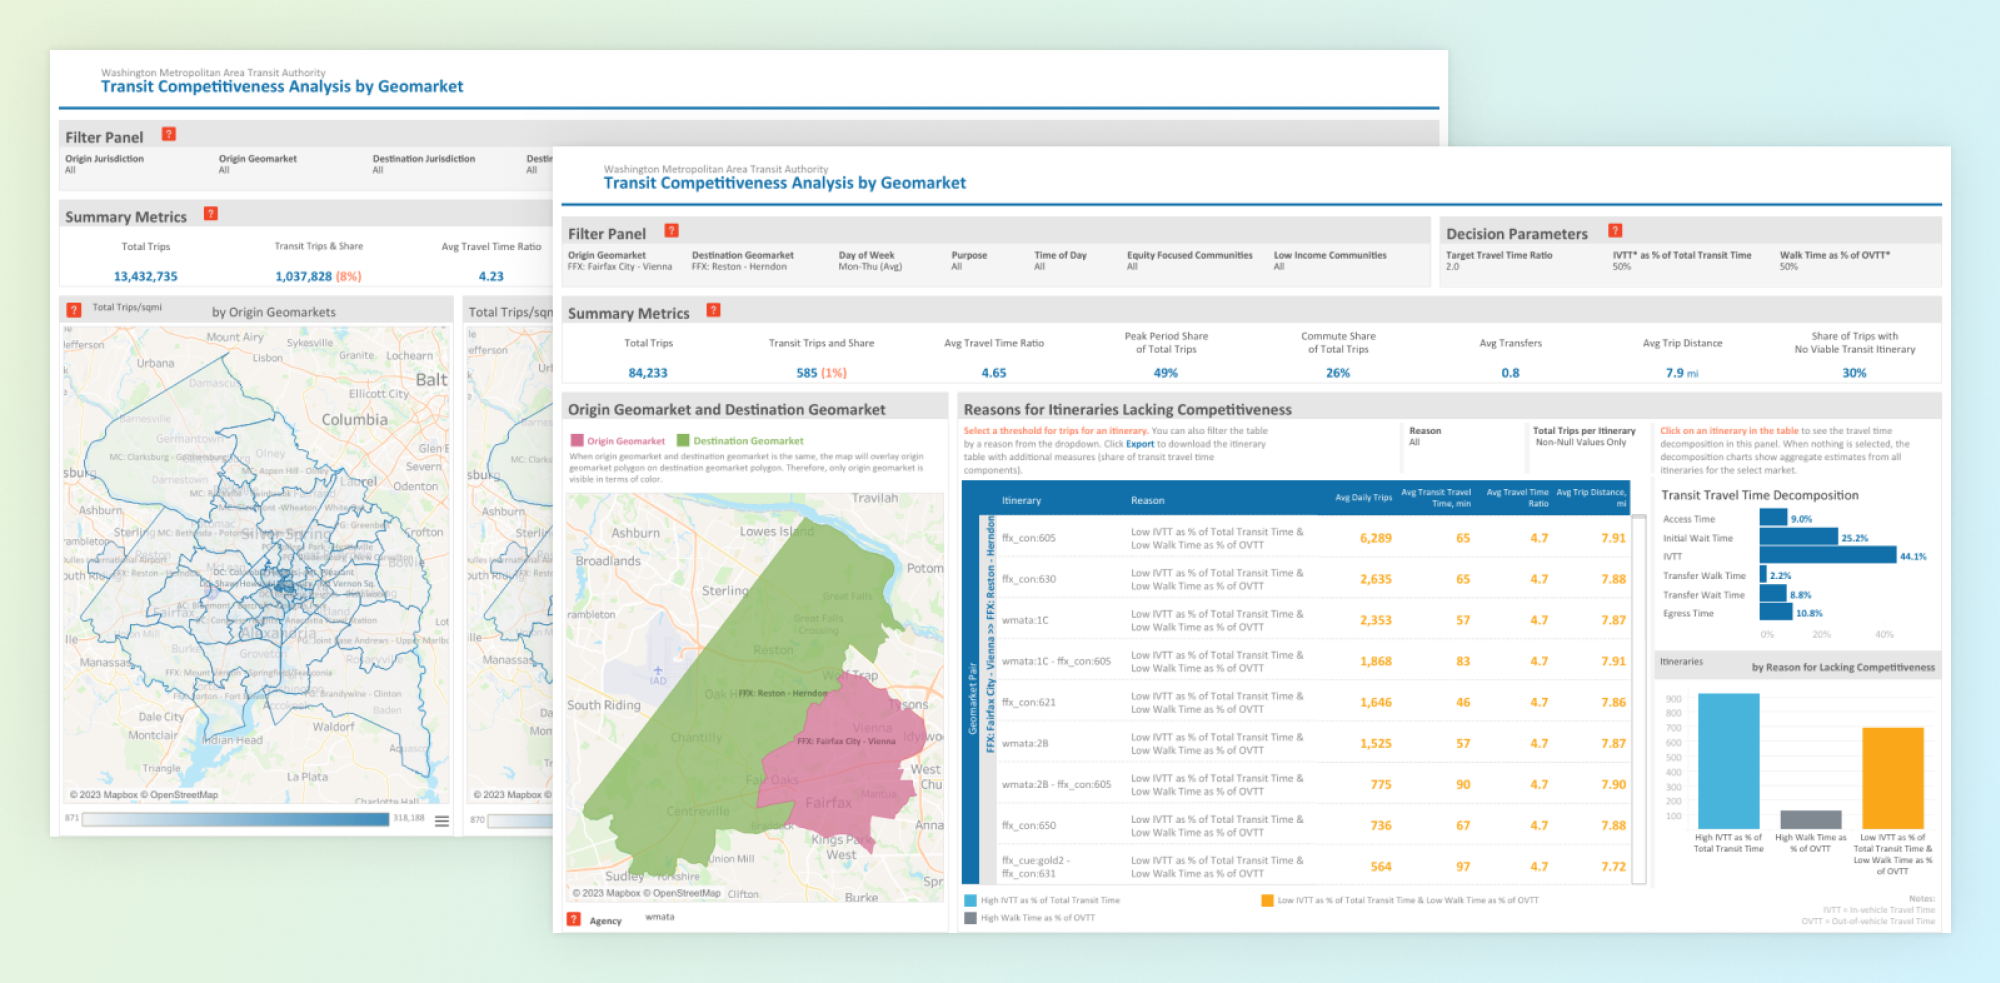
Once we understand the competitiveness of transit in the region, we must identify any untapped markets: where are people not using transit? Two datasets are crucial to answering this question: one that captures the overall travel market and another that indicates transit travel (a subset of the total travel). We generate trip tables using location data from connected vehicles, smartphones, and a variety of other sources. Then, we can anonymize, expand, and thoroughly validate the data. LOCUS infers transit travel from a combination of smart farecard data and automated passenger counts (APC).
Next, we need to isolate the reasons why transit is less competitive in these markets. How long are these trips taking that people are deterred from selecting transit? Using actual start times (not just a representative set of trips within a certain time period), we can evaluate detailed transit itineraries, with information on the best routes. The total travel time is broken down into its individual components: access, egress, waiting, time on vehicle, and transfers. We then compare these transit itineraries and transit times to the best drive paths and drive times, accounting for observed congestion patterns.
How can these insights better inform the network redesign?
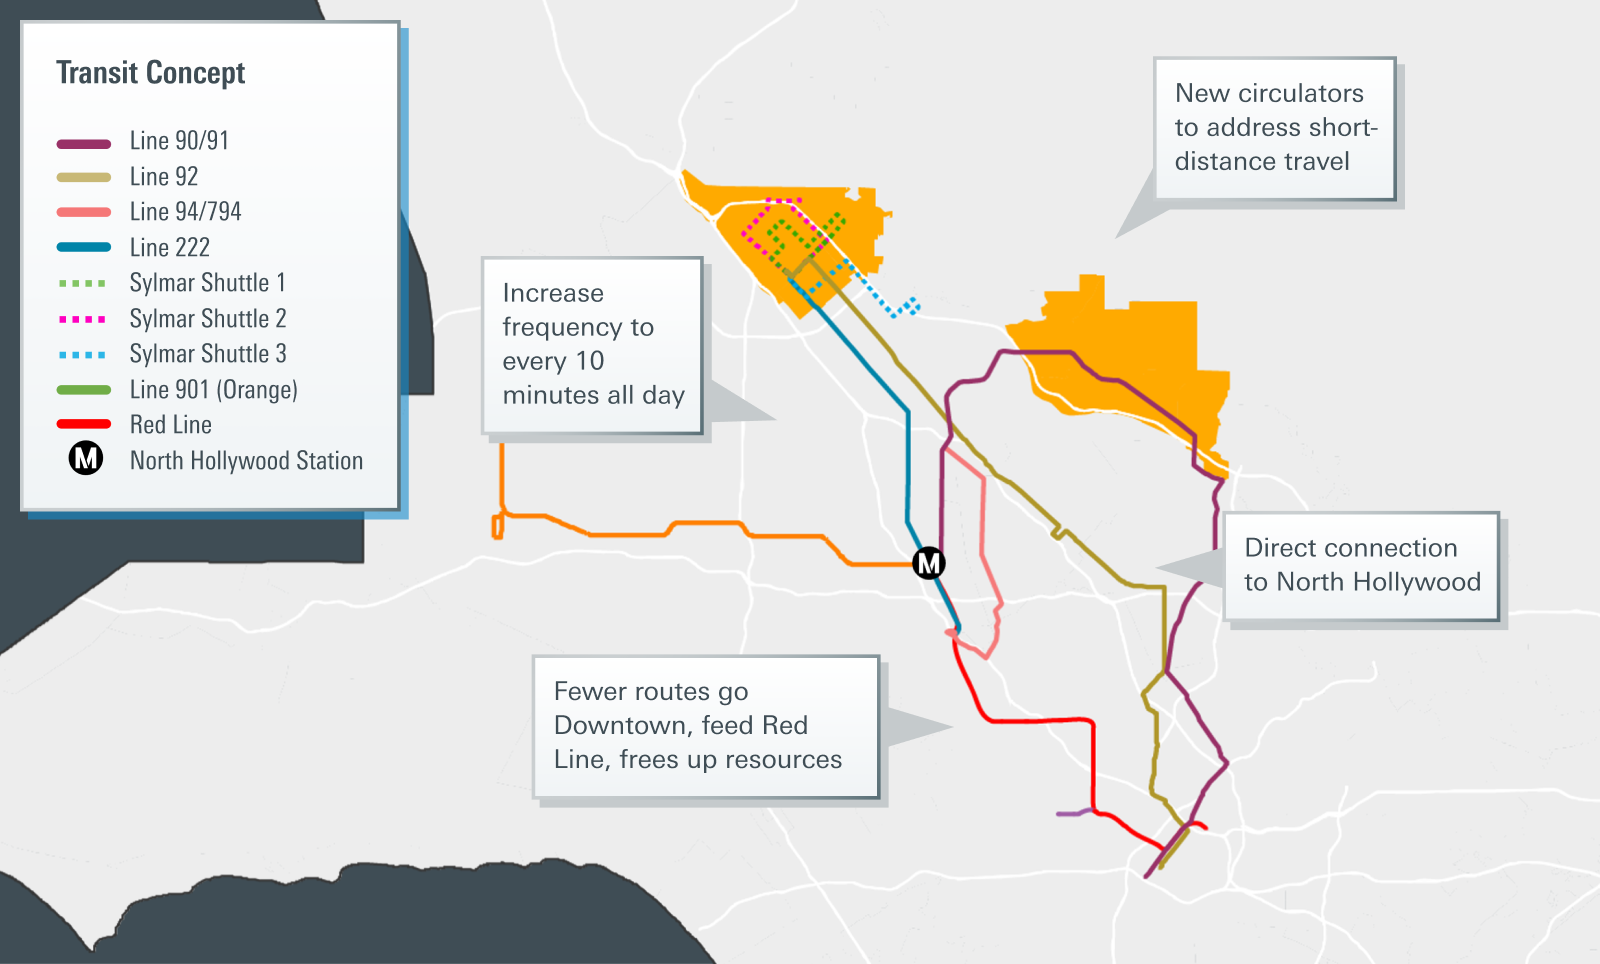
Now that we better understand the full picture of the current transit landscape, the next step is to translate these insights into real changes on the ground. The network redesign can include restructuring routes, modifying frequencies and service spans, simplifying service types, and optimizing transfer connections.
We have partnered with several transit agencies, large and small, across the country to leverage big data tools to allow transit to compete against alternative services. Agencies of all sizes have worked with us in the past: previous clients include Los Angeles Metro, Washington DC Metro (WMATA), NCTD in San Diego, and Denver RTD.
To better understand the various moving parts that comprise a comprehensive network redesign, take a closer look at our work with LA Metro.
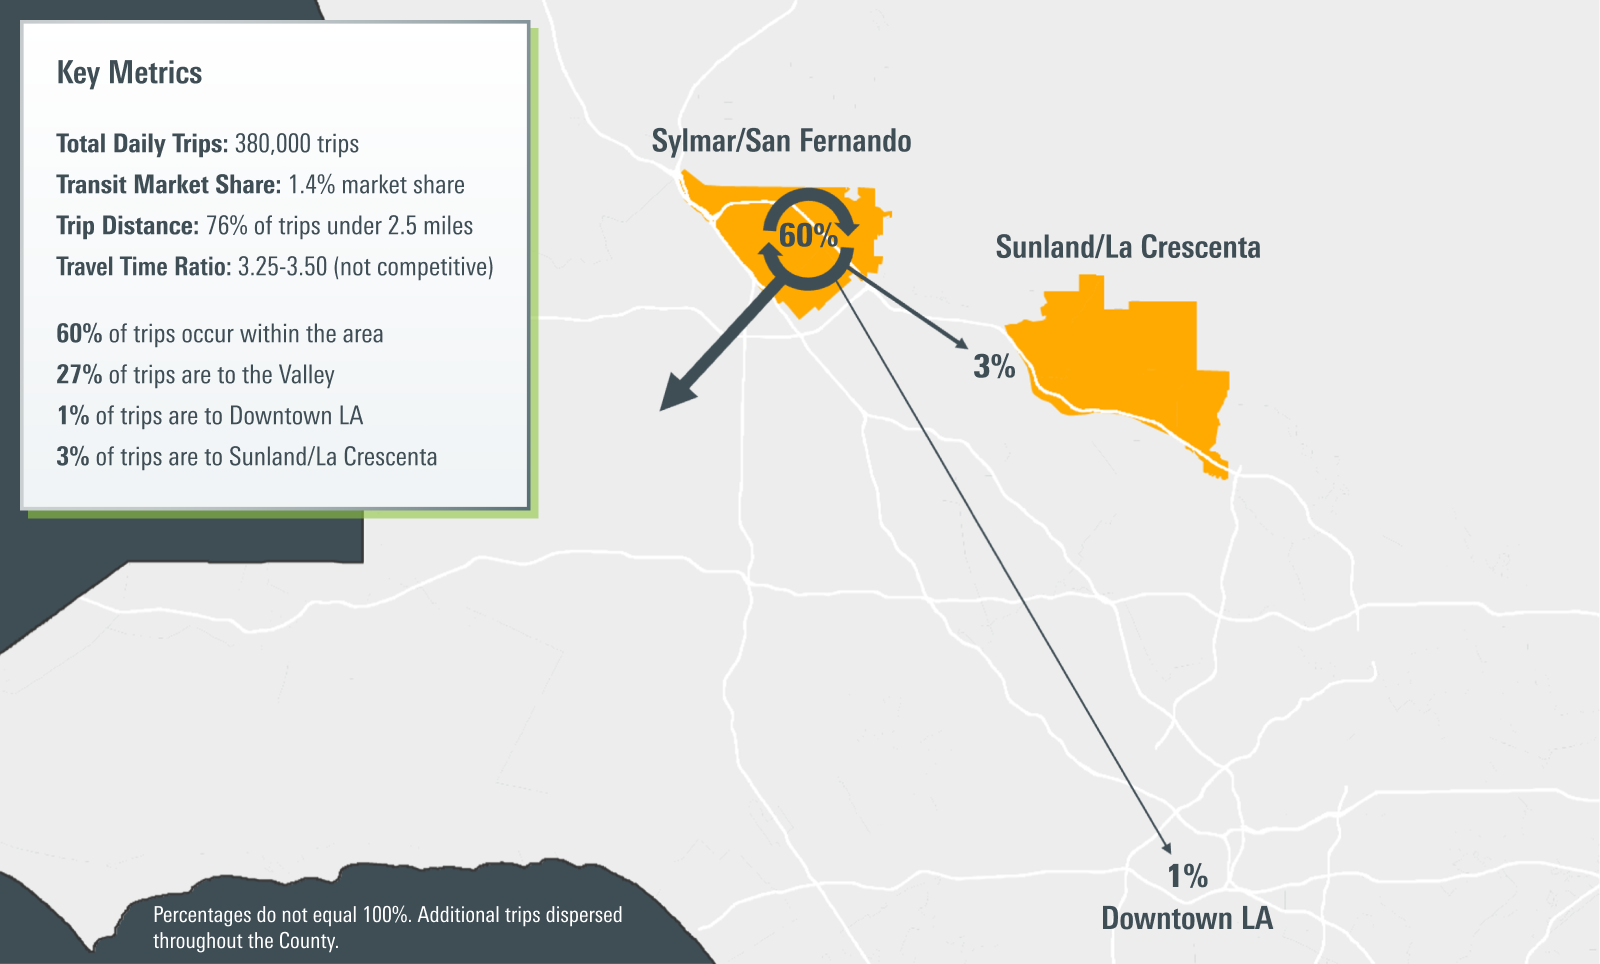
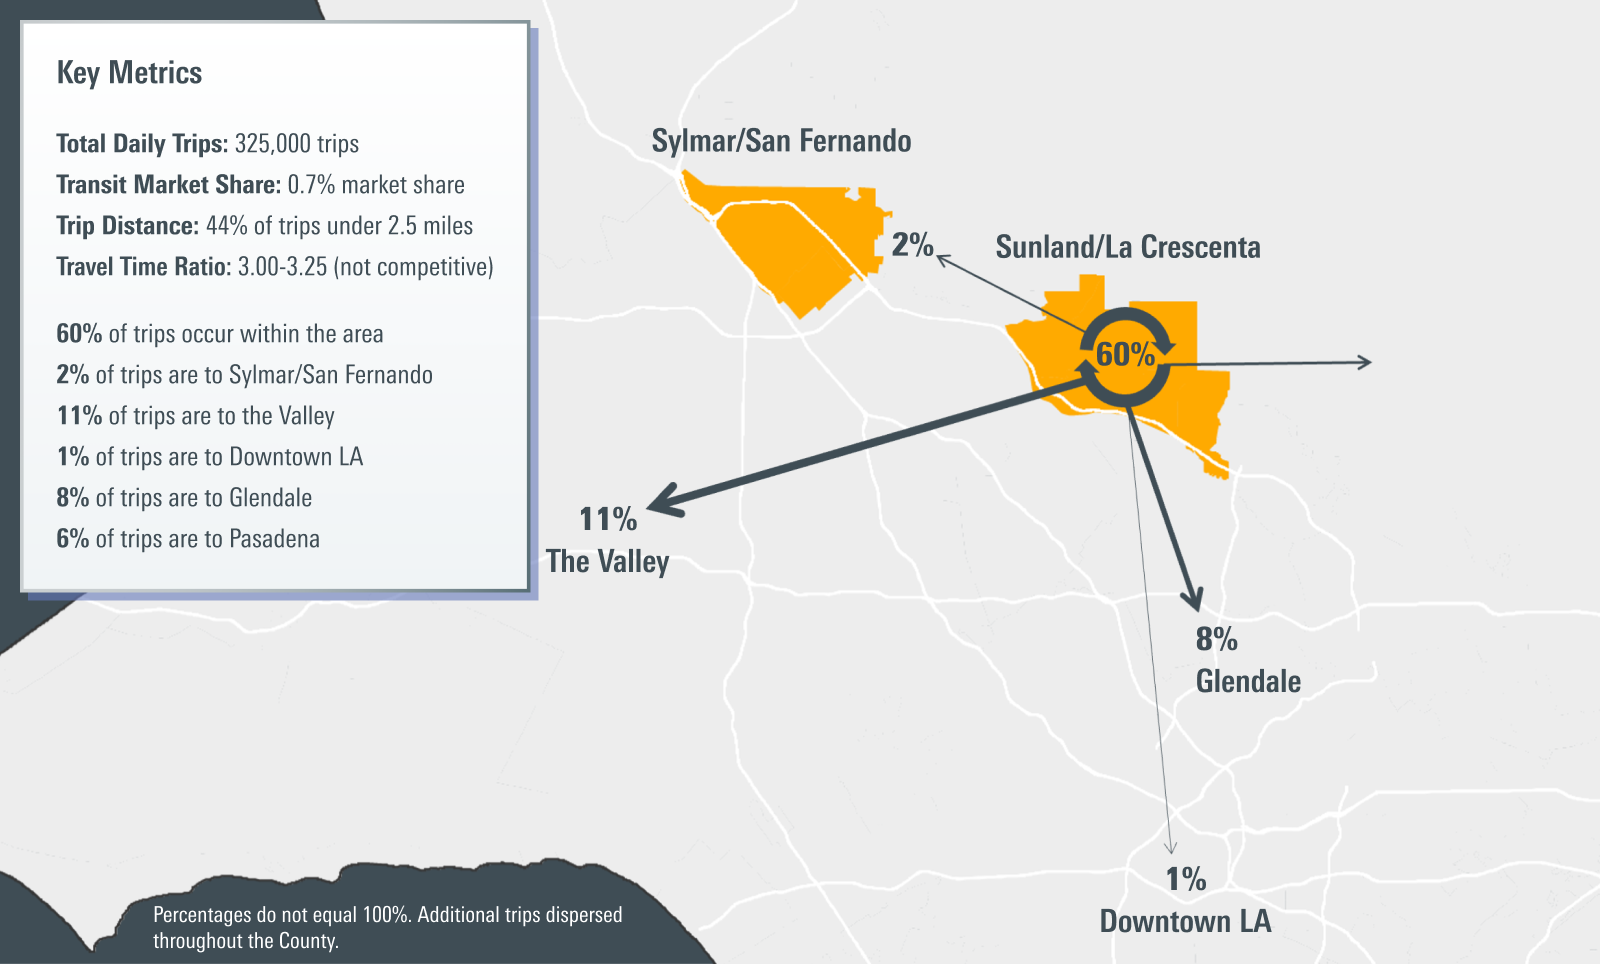
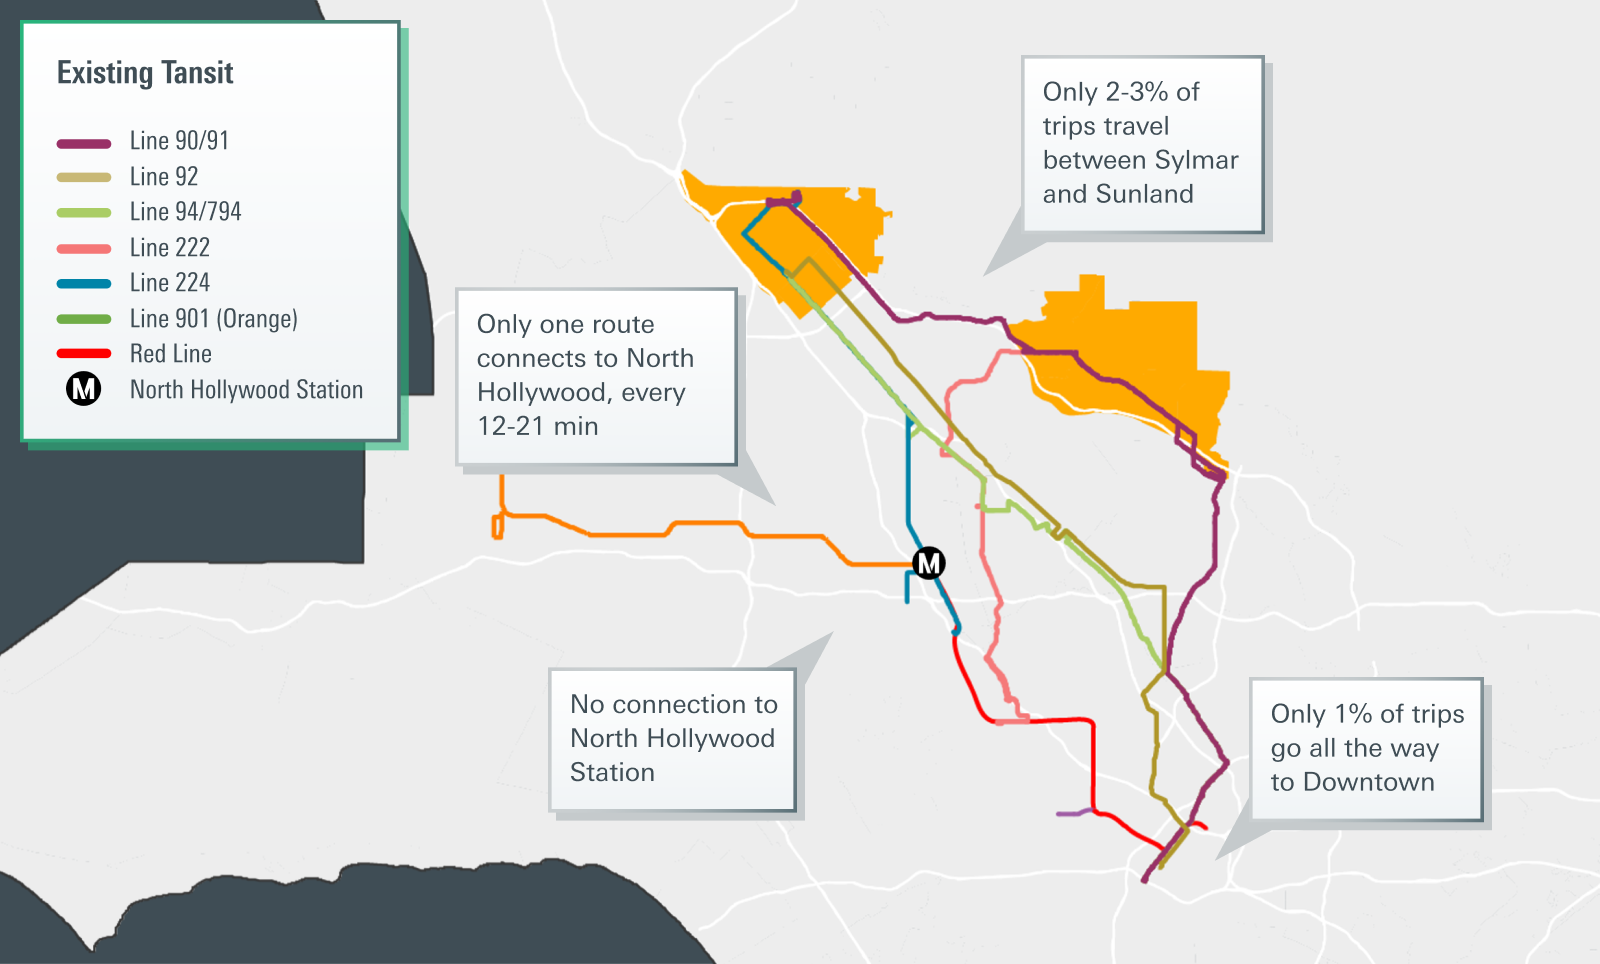
Case Study: LA Metro Redesign
We worked with LA Metro to better understand the full picture of how people are actually moving in the region using LOCUS. We evaluated new network options using key performance indicators, such as competitiveness, accessibility, population/employment coverage, route simplicity, expected ridership impacts, and greenhouse gas (GHG) emissions. We also asked, “what are key origin and destination pairs that would benefit from public transportation routes? Where are key hubs or transfer connections?”
Scroll through the slides below to learn more about this redesign project and its results.
A More Connected Future
While the challenges posed by shifting demographics, private entities, and post-pandemic impacts are real, so are the opportunities. The past may have seen stagnant public transit systems amidst a rapidly shifting world, but ultimately, the future of public transit lies in our ability to be agile, informed, and inclusive. Armed with advanced data insights and a renewed focus on equity, agencies have the potential to reshape public transit in ways that better meet the diverse needs of their communities.
Curious to learn about how LOCUS can be used for your planning needs?