Then + Now is a blog series on the evolution of the transportation planning practice. This series sprung out of our 50th anniversary theme “Honoring the past > Shaping the future.” Last year, we looked back on our rich history of innovation, and now, we’ll dive into specific areas of transportation to tell the story of how it has changed over the years. In each installment of the series, our experts cover a specific topic – such as resilience, modeling, or transit network planning – recounting the work that propelled it forward and sharing key considerations as we plan for the future.
A Brief History of Bus Networks
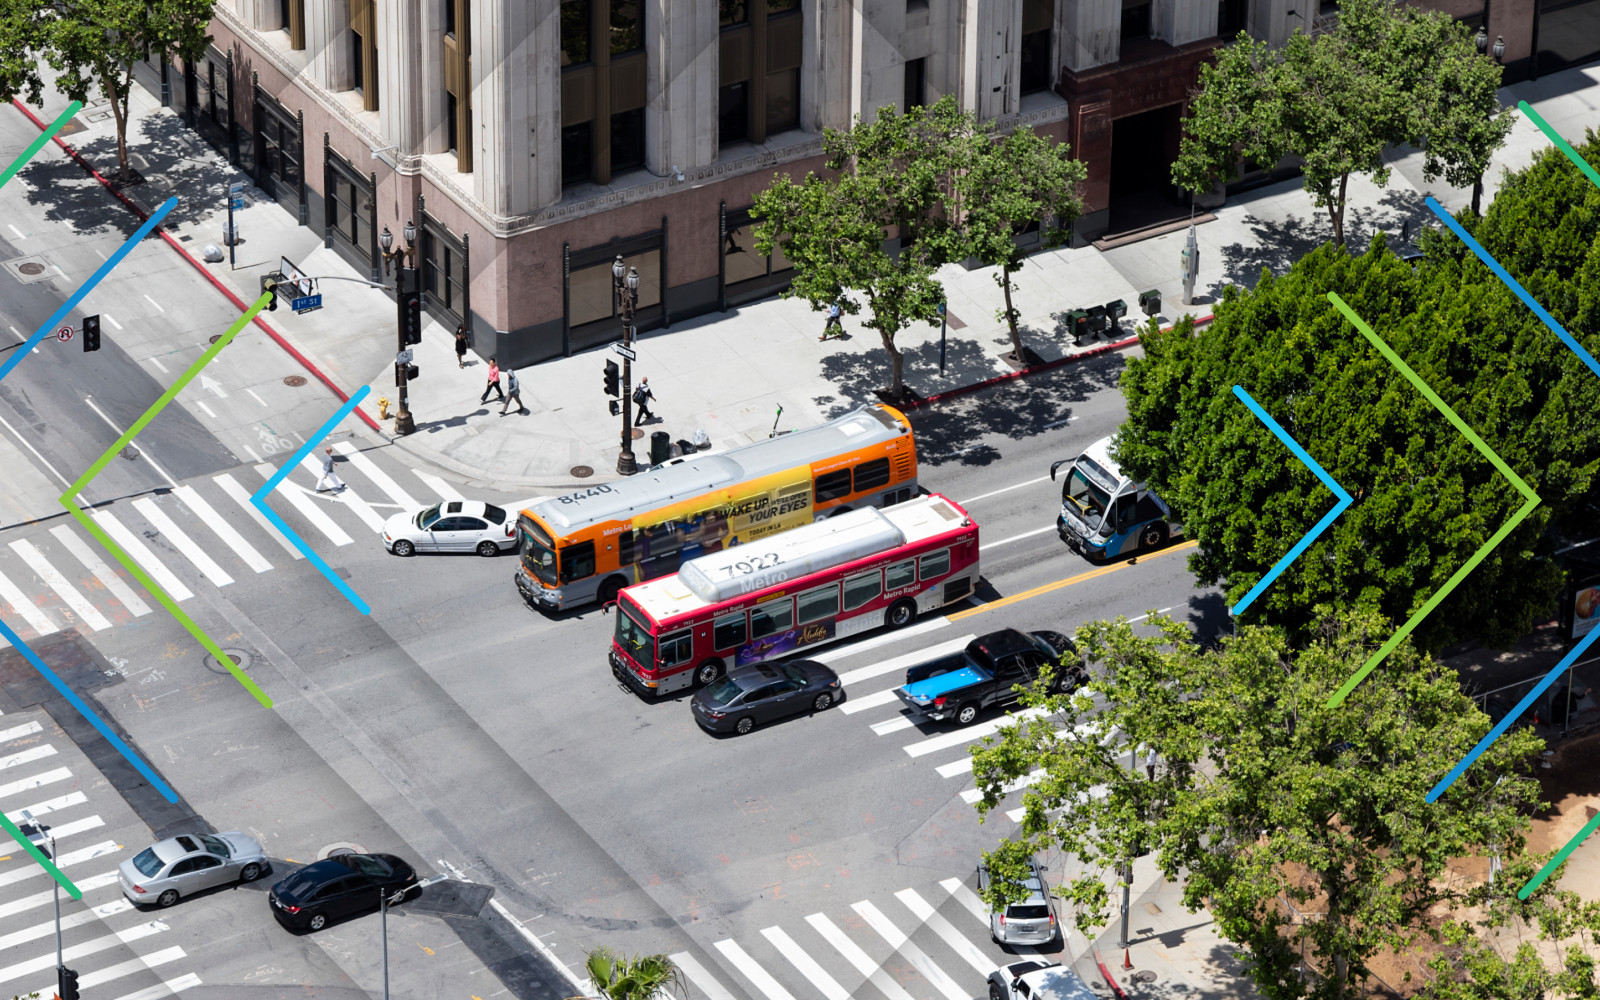
The bus is the backbone of every transit system in the world, connecting people to jobs, grocery stores and other essential services. In many American cities, bus routes were laid out after WWII, following even older streetcar lines that started to disappear as many wealthy residents fled cities for the suburbs. Much like how our cities don’t look the same as they did 80 years ago, they don’t function the same way either. For decades, changes to bus systems were typically limited in scale – add a turn to this route to serve a new apartment building, layer on a commuter bus service from the suburbs, change frequencies or hours of operation – but the route structure remained essentially unchanged. This meant that the bus system wasn’t designed to meet the needs of today’s residents and didn’t provide convenient connections to the places people wanted to go to at the times they wanted to travel.
The 21st century brought with it the realization that, to design bus systems that worked for today’s cities, the network had to be fundamentally redesigned as part of a more holistic system.
Because transit agencies have finite resources, bus redesigns are inherently an exercise in tradeoffs – transit agencies simply cannot provide high frequency bus service to everyone, everywhere, at all times of day. Early bus network redesigns focused primarily on a simple tradeoff: should we focus on providing some service everywhere, or frequent service where it will be used the most? Agencies reallocated resources based on the desired balance between coverage and frequency, but the data that informed their decisions was limited. Infrequent rider surveys were often the only source of information on customer travel patterns and desires, and they did not paint a comprehensive picture of transit needs or desires of the community.
Data Powers a Transformation in Bus Redesign
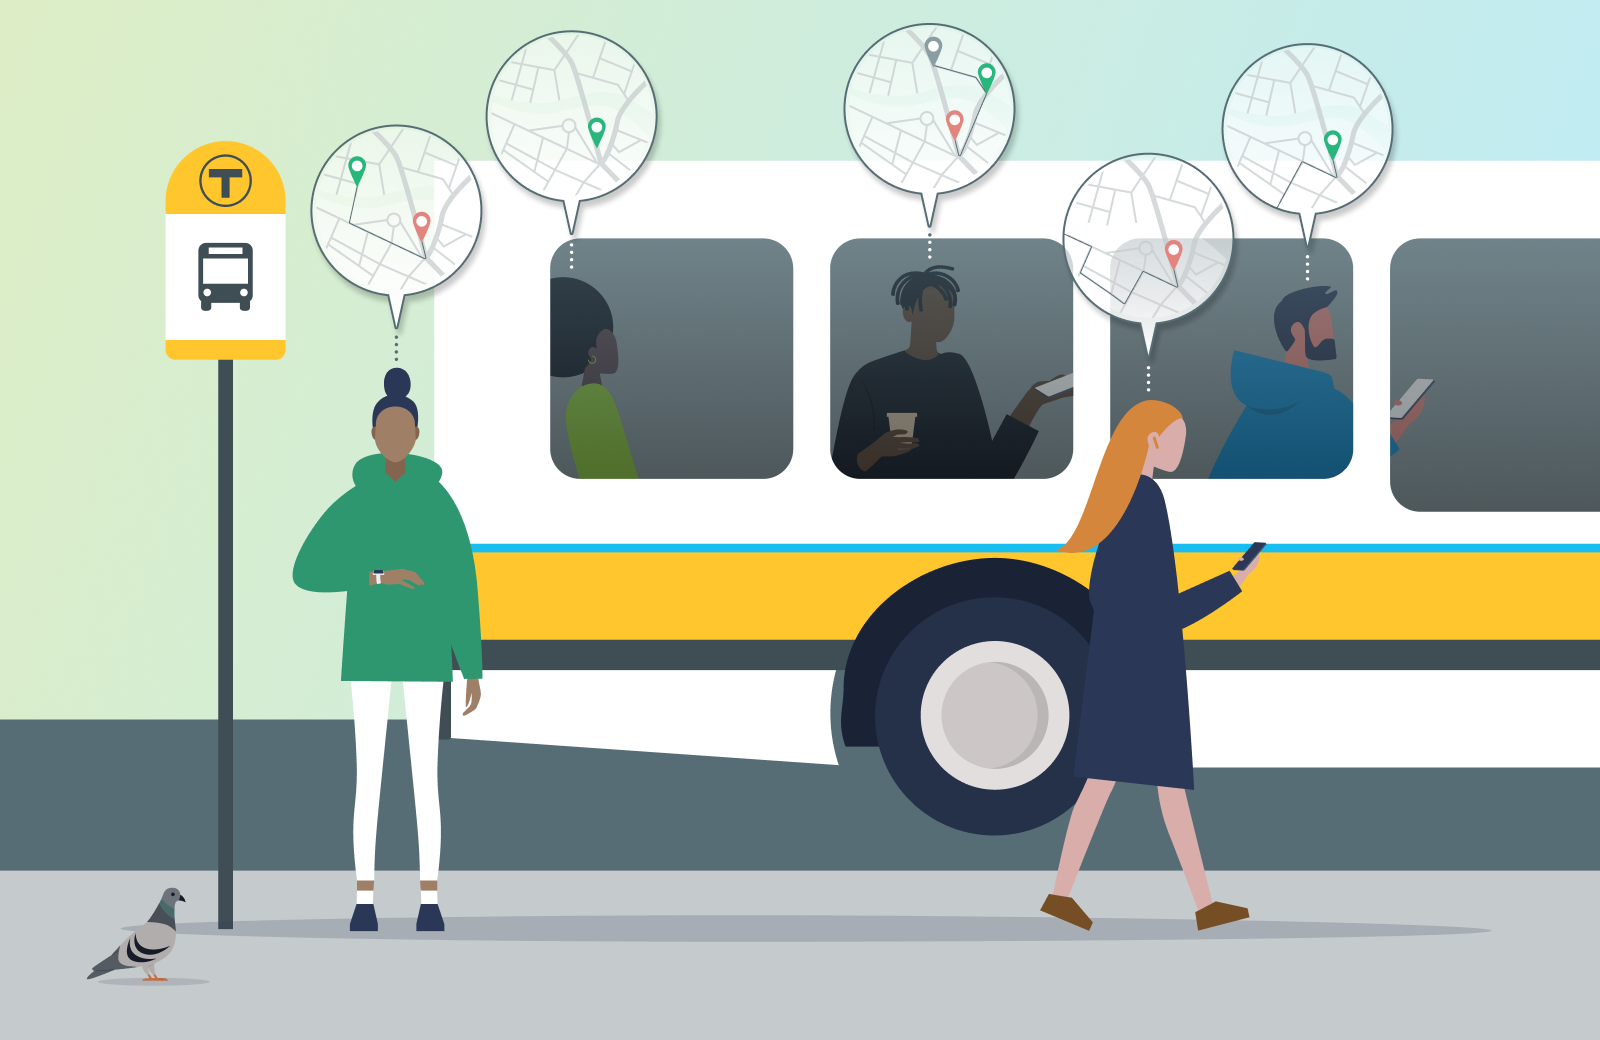
Using location-based services data (primarily from cell phones), we could see where and when people were traveling and how much of this travel was done by low-income or marginalized travelers. Knowing where these groups were traveling allowed us to design services to make their experience easier. Read more.
Now, we have the ability to make decisions based on a much richer pool of data, including stop-level ridership data from Automatic Passenger Counters (APCs), on-and-off data from fare cards, operational performance data from Automatic Vehicle Location (AVL) systems, and Location-Based Services data (LBS), which measures anonymized information about where millions of people travel every day.
Our approach to bus network redesign leverages all these data sources (and more) to consider the needs of the communities we work in. This data-driven approach to Bus Network Redesigns was pioneered by CS, in partnership with LA Metro, and has been adapted for local use by numerous agencies across the country. For example, for the Bus Network Redesign that we recently completed in the Boston region, one of the primary goals was to identify the best corridors for investment in high-frequency service. Using LBS data from LOCUS, our team developed a methodology for identifying and prioritizing potential high-frequency corridors across the region based on the extent to which they served regional travel needs. This methodology also heavily weighted the needs of low-income residents and people of color.
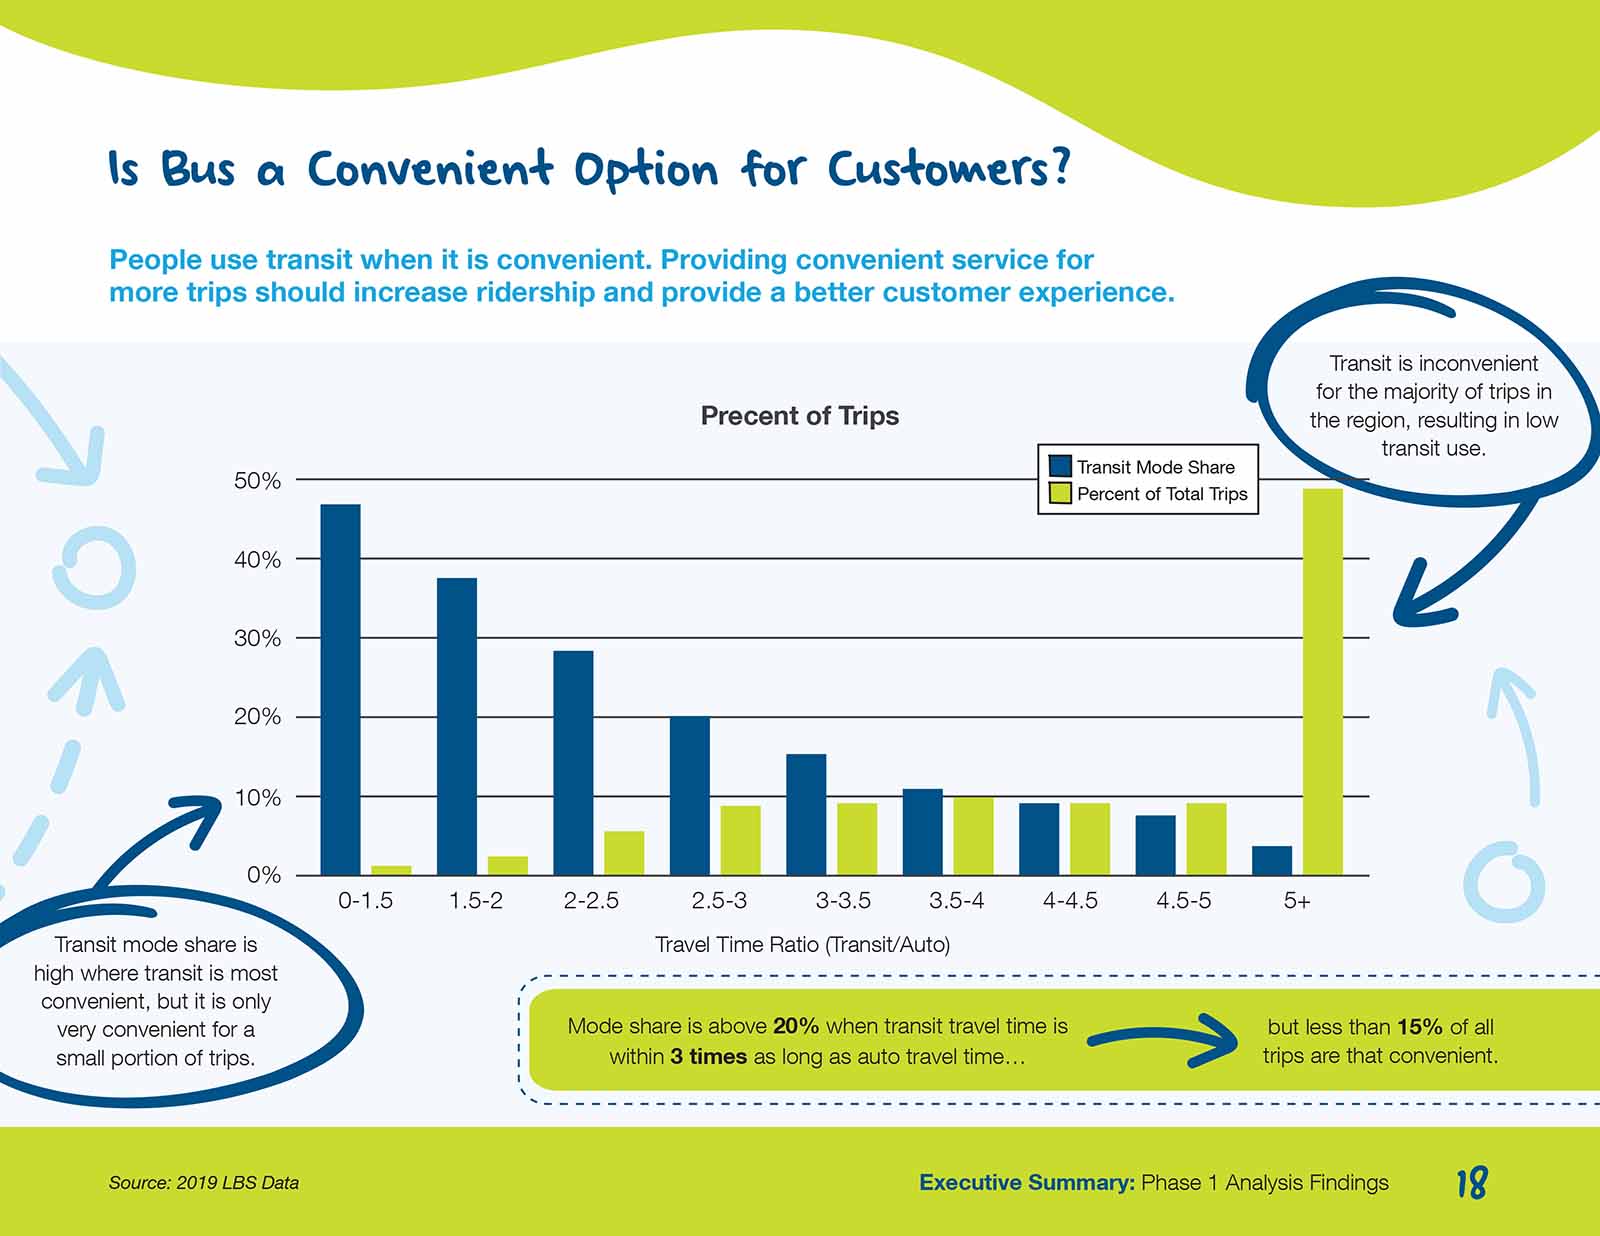
LBS data analysis shows that transit mode share is above 20% when transit travel time is within 3 times as long as auto travel time, but less than 15% of all trips are that convenient. Read more in this report of the phase 1 findings of the WMATA Better Bus Network Redesign.
In our work to support the Washington Metro Area Transit Authority (WMATA) Better Bus Network Redesign, one of the ways that our approach balanced customer needs across a diverse geography was building an understanding of where service aligned with needs. Our analysis of LOCUS travel flow data, ridership data from WMATA’s Trace Model, and travel times showed that transit use is highest where transit is reasonably competitive with other options like driving. So, our goal was to identify travel markets where improvements to bus service could make transit a more competitive option. We also hoped to improve accessibility and mobility for equity communities in the region by identifying markets where service changes could improve accessibility and travel times for customers who may not have an alternative to transit.
The resulting WMATA network did more than add more service to existing routes: it provided new cross-town connections, opening the door to more opportunities for many bus riders.
“We have used LOCUS for a variety of projects including bus network redesign, COVID-19 recovery, multimodal corridor planning, and transit competitiveness assessments. We are pleased with the collaborative approach that the LOCUS team brought to the table and also with project outcomes that resulted from using LOCUS.”
— Conan Cheung, Chief Operating Officer, LA Metro
Navigating Changing Travel Patterns and Funding While Elevating Customer Experience
The new wave of data-driven redesigns will continue to evolve as travel patterns settle after a pandemic-induced period of upheaval. Transit agencies across the country will have to reconsider the tradeoffs they’re making in light of new funding challenges, increased telework, and changes in development patterns. The good news is that the same tools that facilitate once-in-a-generation comprehensive redesigns can also be leveraged on an ongoing basis to identify routing changes and frequency tweaks that will benefit customers. The more we can learn about how customers respond to these changes, the better those recommendations will be moving forward.
Fifty years from now, things may look very different, but if we play our cards right, bus networks will still play a huge role in helping people get where they need to go, helping our cities be more efficient, sustainable, affordable, vibrant and environmentally friendly. Reach out to us if you’re interested in learning more about how better data can revolutionize your bus network.
Connect with Us