Leveraging Big Data to Create an Equitable, Optimized Bus Network
The project team was able to use location-based services data and algorithms to design tens of thousands of potential bus networks for the MBTA.
The project team was able to use location-based services data and algorithms to design tens of thousands of potential bus networks for the MBTA.
The MBTA is redesigning its bus network to reflect the significant changes that have occurred over the years in demographics, travel patterns, employment districts, and congestion across the Boston Region. Cambridge Systematics (CS) - along with our teaming partners Arup, Regina Villa Associates, and Marlene Connor Associates - has played a key role in helping MassDOT and MBTA redesign this network. The proposed draft bus network is out now for public comment and can be found here: mbta.com/BNRD.
The project team was able to use location-based services data and algorithms to design tens of thousands of potential bus networks.
The traditional approach to a bus network redesign focuses on connecting typical origin locations (such as residential areas) and destination locations (such as employment centers) in ways that may or may not reflect where and how people are actually traveling in a region. In contrast, for the MBTA, we built the redesigned network from real-world travel patterns and behaviors so that we would be able to design services for where and when people are actually traveling. This is particularly relevant in light of the disruptions hastened by the pandemic.
No agency has unlimited resources, so every system redesign involves tradeoffs in determining where and when to provide service. However, by starting with the data on how people actually travel, CS was able to provide MassDOT and the MBTA with the types of networks that could most readily meet their goals for equity and efficiency, without bias toward existing network structures.
For an agency to design fast, frequent, and competitive transit services for everyone, it's imperative that the planners, stakeholders, and customers work together. Our analytical methods give communities a head start on this collaborative process and a solid foundation for decision making. Ultimately, these methods can help agencies create an equitable mobility landscape for a rapidly evolving future.
One of the principal components of our process is using an algorithmic approach to design the high-frequency, core routes of the new bus network. Using this approach, CS and Arup worked with MassDOT and the MBTA to design not just a couple of potential network alternatives, but actually tens of thousands of possible high-frequency bus networks. The team then evaluated these networks and selected a preferred network as a baseline to build into the draft map you see today.
Dividing the region into "Bus Analysis Zones" (BAZs) – We segmented over 800 small geographies built up from Census block groups, each meant to cover an area within a reasonable walk distance from a bus stop.
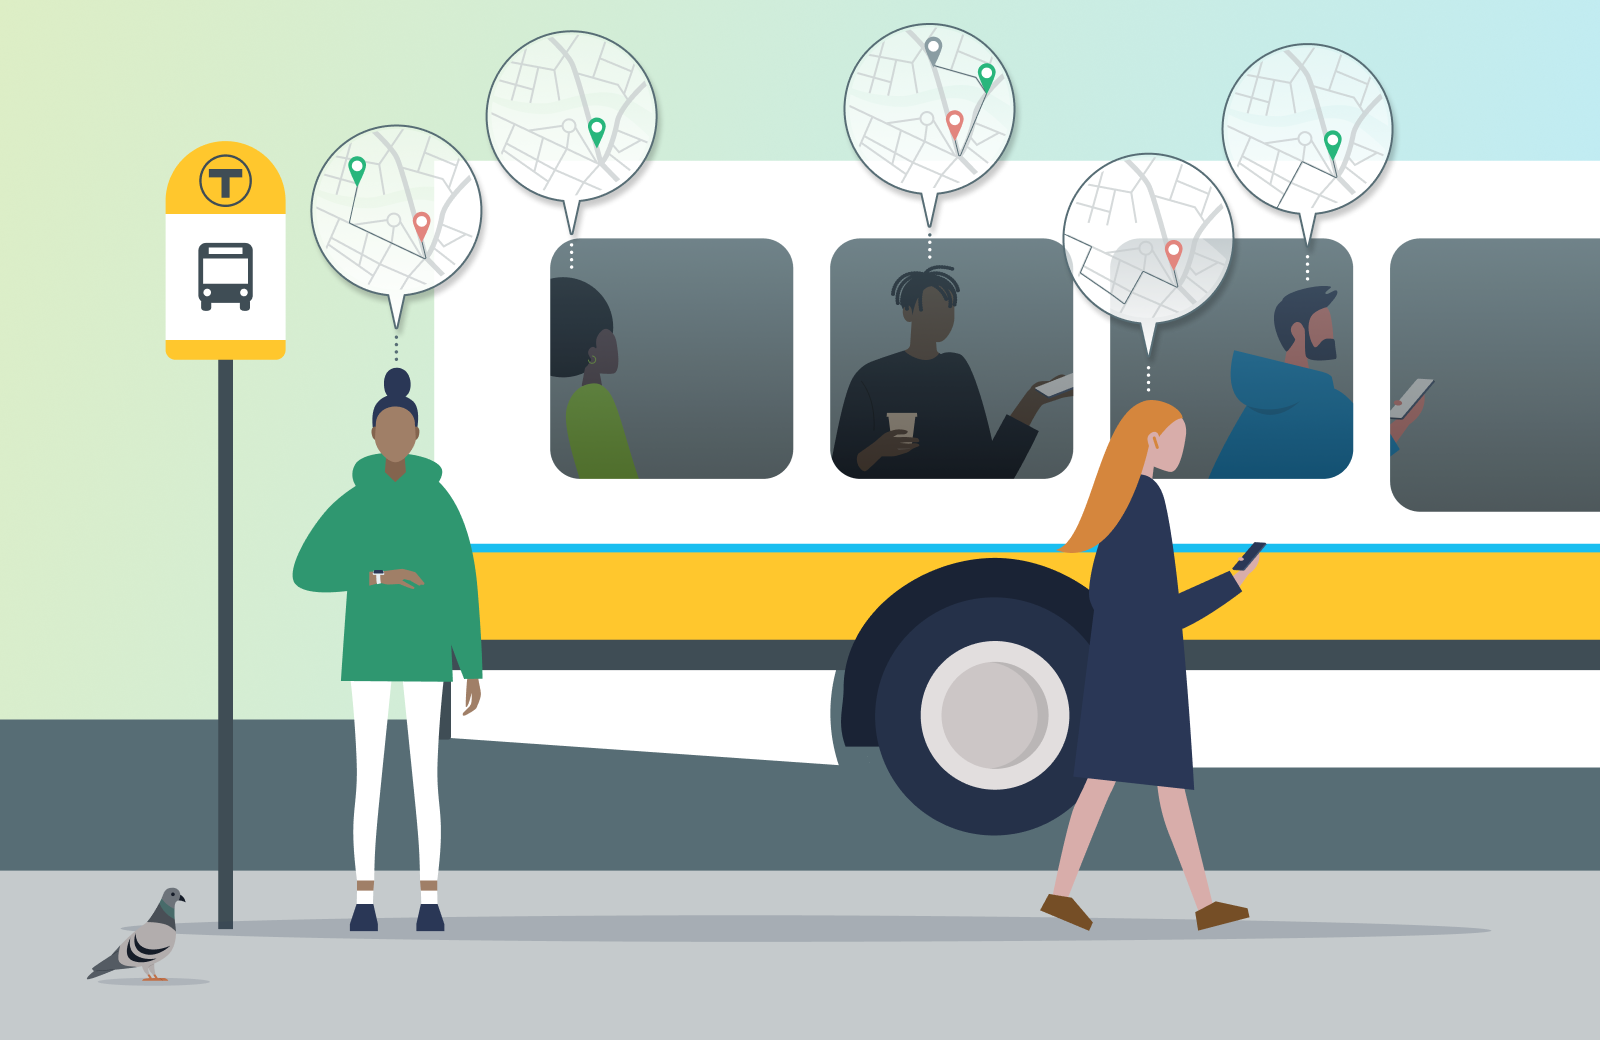
Quantifying demand - Using location-based services data (primarily from cell phones), we could see where and when people were really traveling around the region (over 85 million trips per week). With a focus on equity, we also quantified how much of this travel was done by low-income or marginalized travelers. Knowing where these groups were traveling allowed us to design services to make their experience easier.
Identifying all the "busable" streets in the region - Boston's street network is notoriously messy, and there are many streets that buses cannot use because of height limitations, turning radii, or hills that are too steep in winter weather. Combining the busable streets with the bus analysis zones, we created a web of BAZ-to-BAZ connections that included all adjacent busable connections in the region.
Building realistic corridors that connect high-demand geographies along busable streets - We automated the creation of 14 million possible high-frequency bus corridors from this web, then filtered that down to approximately 92,000 that would be the best candidates for high-frequency service based on length, circuity, overlap with rapid transit lines, and demand served.
Developing sets of corridors into networks – We grouped corridors into networks of high-frequency service that connect the region. We weren't able to make every possible set of corridors: with 92,000 possible corridors and 20+ corridors in each constrained set, there were more possible combinations than atoms in the universe!
Therefore, we had to set up a process that created many good networks, instead of all possible networks. We weighted each corridor based on how much demand it served per mile, with additional weighting on demand from low-income and marginalized travelers. Again using the computer, we selected corridors semi-randomly (by weight) to create 20,000 different possible networks, each using approximately the same amount of resources.
Evaluating the networks – Using the demand data, we evaluated each set of corridors based on the amount of demand served by that network, including two-seat rides and transfers to the Rapid Transit network. This evaluation, again, prioritized demand from low-income and marginalized travelers. The top handful of sets were reviewed by service planners, and one was finalized and selected to become the basis of the high-frequency network you see in the draft map today.
Refining the core and building out lower-frequency routes - The high-frequency core provided the backbone structure to the overall network, but still required a human touch from service planners. Once the core was finalized, the lower-frequency routes were built out around this refined core network.
This process demonstrates the power of using location-based services data to understand actual travel patterns in a region. It allowed us to center equity in our approach at the origin-destination level, and test out orders of magnitude more possible route designs than could have ever been done by hand.