Passenger mobility has begun a profound transformation. Social and technological entrepreneurs are launching new mobility innovations into the marketplace at an accelerated pace by leveraging the internet, smart phones and GPS. These technologies and the increasing proliferation of new shared service options have already dramatically affected travel behavior, in particular mass transit ridership. For instance, thirty one of the thirty five major metropolitan areas across the US have lost significant transit ridership in part to the disruption of new mobility options. Future innovations will likely be even more aligned to changing preferences and mobility patterns, thus disrupting transit usage even further. For transit agencies to compete successfully in this crowded market space, they need to consider reinventing and positioning themselves as nimble, data savvy, and most critically, as market-driven organizations that provide bespoke services to their existing and future rider base.
To this end, an agile transit agency must develop a comprehensive market analysis of travel patterns throughout their service area. Such an approach organizes the vision around understanding where, when and why demand for transit is sufficient and sustainable enough to maintain, imagine, and build transit corridors. It also allows transit agencies to withstand local and political pressures to implement unsustainable transit solutions. It is the opposite of an inefficient “build it and they will come” vision, rather it espouses the use of limited funding to maximize the value to local users.
Effective market analysis starts with and depends fundamentally on rigorous data-driven research. This approach can be implemented using a five-step approach:
1. Listen to Customers
The days when agencies would only conduct surveys of their existing customers are long over. Increasingly, agencies understand that they need to interact with their ex- and non-riders as well. Fortunately, social media and online data collection platforms provide low cost, high coverage access to a wide user base and can help identify key patterns of usage, challenges, and some of the underlying causes of declining ridership. Agencies like Los Angeles Metro, for example, are conducting minimal cost surveys through Facebook that reach tens of thousands of ex- and non-riders in specific corridors and neighborhoods, and are completed in record time.
2. Be Hyper-Aware of Customer Usage Patterns
Agencies have been increasing their use of farebox, automatic passenger count (APC) data, and route performance measures to study how their system performs. Agencies should take this a step further and improve their understanding of ridership patterns through mining transit smartcard usage to generate fine-grained understanding of their customer’s travel patterns. Since transit smartcards are becoming ubiquitous and acceptance among riders is increasingly high, agencies can use findings from these data to extrapolate to their entire customer base. Through research conducted in Chicago and Los Angeles, Cambridge Systematics has proven that anonymized smartcard data can provide vital business intelligence to answer key questions such as:
Who are my frequent customers and what share of overall transit usage do they contribute? The data and the latest analytic methods show clearly that the vast majority of transit trips are taken by a very small minority of riders; so the loss of only a few frequent riders results in an exponential loss of ridership. In Los Angeles, 15 percent of the top customers over a four-month period were found to make about 80 percent of total trips on the system.
When do my frequent customers travel? And, for what purpose? What can I do to make their travel more convenient? Economic trends show more workers must travel to multiple jobs at dispersed locations. Our most extensive market analysis shows travel patterns that demonstrate enormous potential ridership during mid-day and evening periods when most transit agencies reduce service. When transit is less available for these off-peak trips, workers are discouraged from using transit during peak period commutes as well. Our market analysis not only quantifies this potential, but also locates the specific origin-destination patterns.
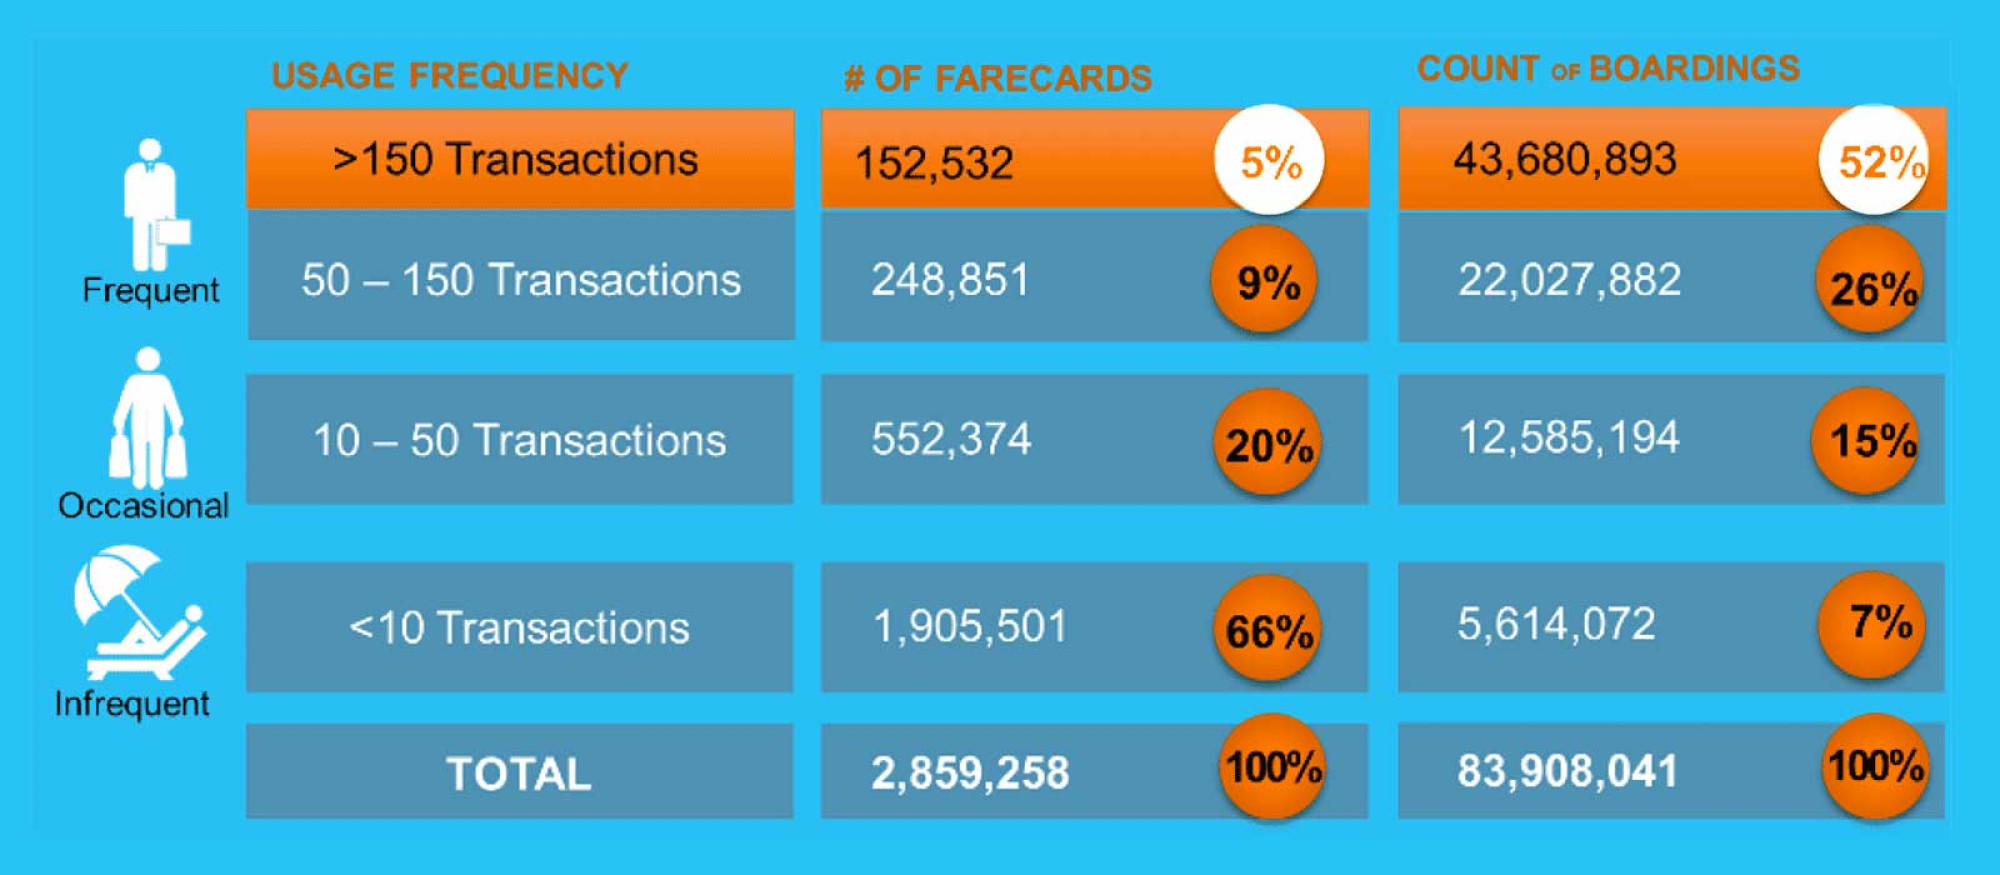
Source: TAP data - Metro and Municipal Operators (July through October, 2017).
By observing the detailed travel patterns over time, we can now make accurate inferences about home and work locations for these frequent customers and the routes that they most commonly take, so we can prioritize services on key corridors at times-of-day that are important to customers.
3. Measure Regional Travel Patterns
Data is fast becoming the fuel to drive today’s smartest businesses; and the most relevant datasets to today’s transportation service companies are location and mobility data. Today, agencies across a wide span of industries are tracking mobile devices anonymously to quantify travel patterns, identify major activity centers, and measure congestion hotspots. Transit agencies must dive into this space so they can better understand regional travel demand on a daily basis and reposition services for greater ridership. Any analytical framework employed should be flexible and modular to ingest new data while being backward compatible as well.
4. Study Competitiveness Through the Lens of a Traveler
The days of a “transit dependent” rider are over because travelers have more mode choices than ever before. In fact, the significant increase in car ownership especially among lower-income households, rampant adoption of new technologies such as Uber/Lyft and numerous electric scooter and dockless bikes by various socioeconomic strata says a clear and loud message: consumers adopt services that are efficient, effective, and right priced. Therefore, transit agencies must understand the travel patterns for various O-D pairs and understand the right levers to tweak for better competitiveness with auto.
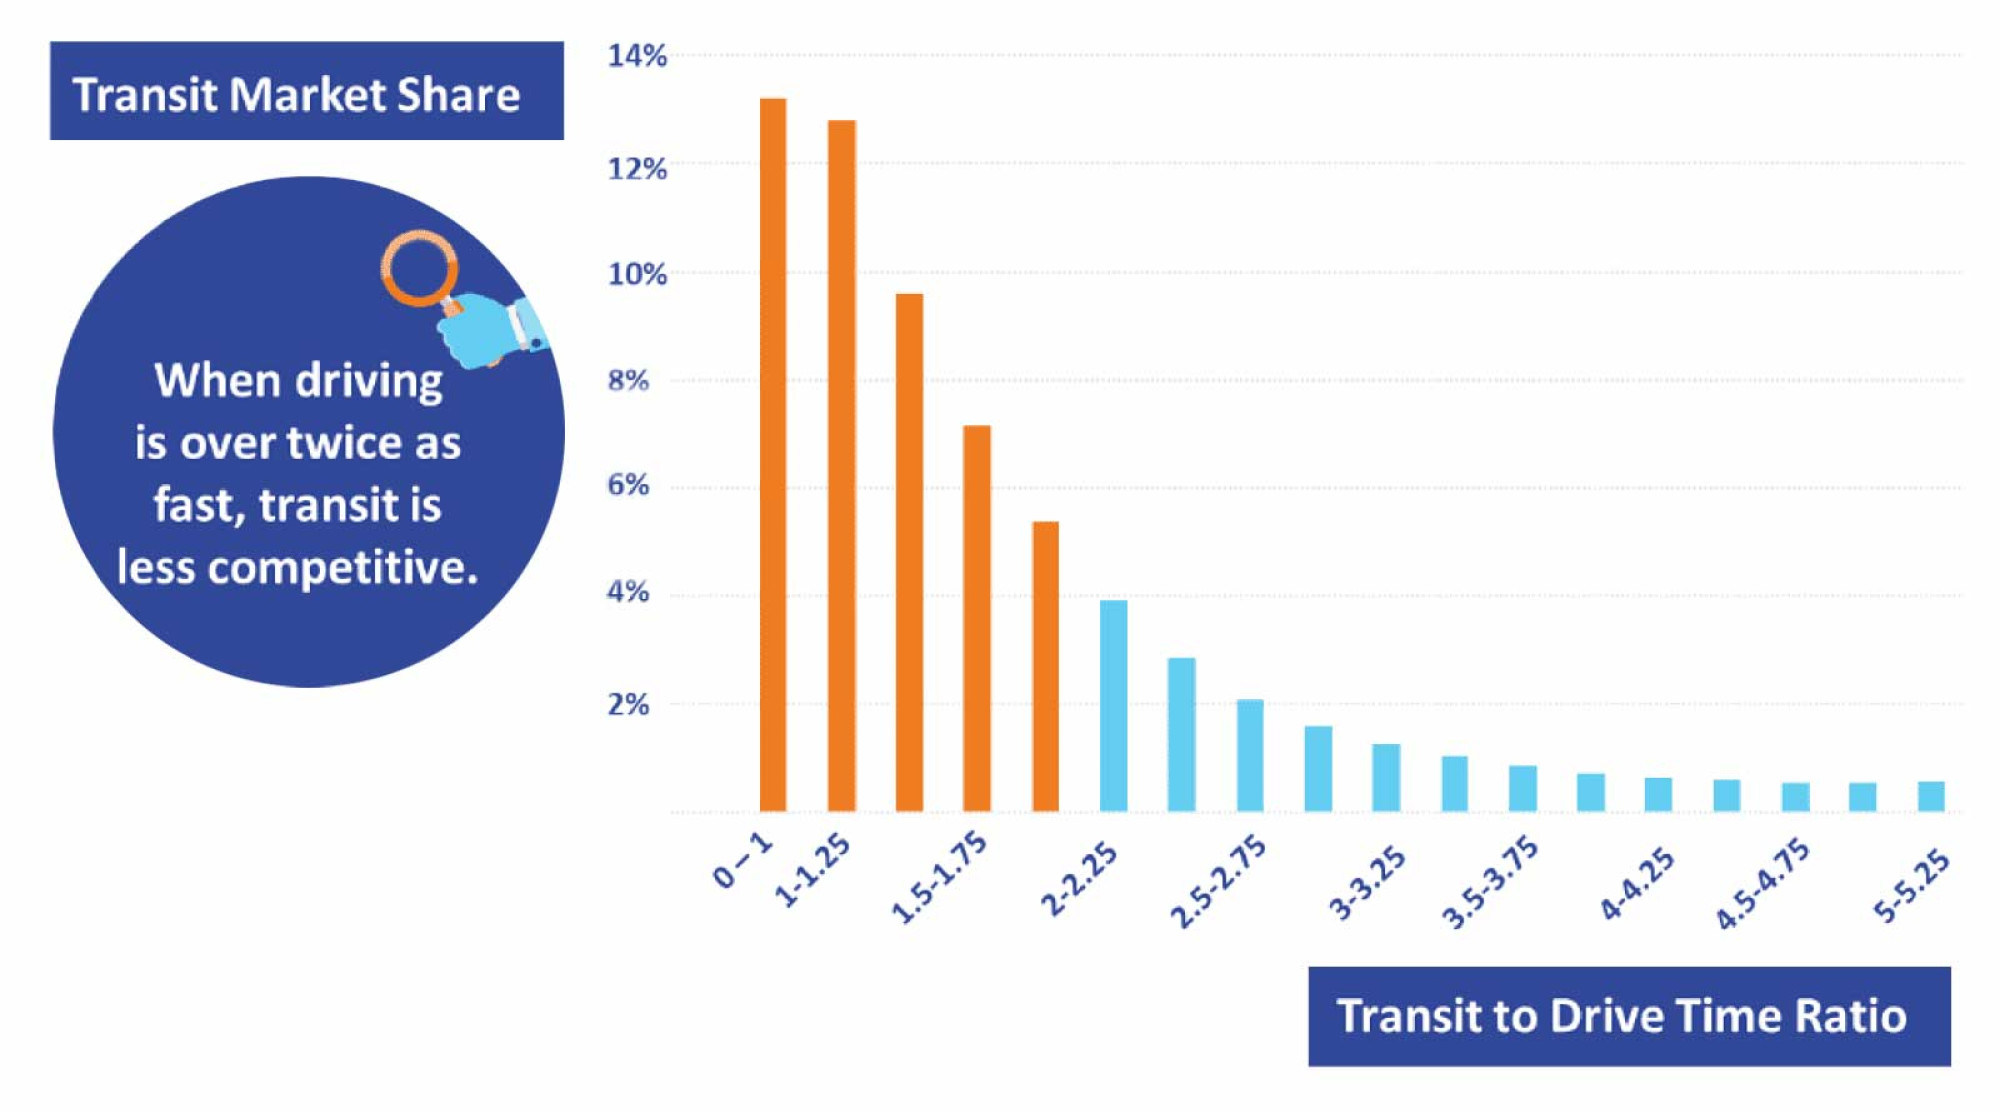
As the chart shows, transit market share remains high as long as transit travel times are 50% or better than auto. This holds true across all travel markets in LA irrespective of locality. It’s not the true speed that matters, it’s the relative speeds.
Similarly, not all legs of a transit trip are equal on all trips. For instance, enhanced frequency is far more relevant for short trips (to minimize wait times) as compared to longer trips, where in-vehicle speeds are critical (riders use apps to arrive at the right time at stops).
Travel Time Comparison with Auto
5. Evaluate Performance Obsessively and Repetitively
As technology changes and modal options increase, agencies must realize that the marketplace reacts to these changes equally rapidly. The days of evaluating service every decade or so is over. Agencies must learn to iterate, tweak, and customize solutions on an ongoing basis using a data-driven framework. As they do so, they must dedicate internal resources, and form strategic relationships where meaningful to enhance the trip-planning, fare payment, traveler information, and in-vehicle experience for their customers.
While undertaking a data-intensive process may seem scary at first, implementing a well thought out and carefully structured framework will help agencies serve their customers better. Our team of experts has a long history of conducting effective transit market research for our clients all across the US. We tailor our solutions so transit agencies of all sizes can cost effectively benefit from advanced market research procedures.
To learn more about Transit Market Research, please contact: